Hygeia AnalyticsLogo

Menu

Skip to content
  • Home
  • About Hygeia
    Analytics
    • Dynamic Presentations
    • Keywords and Site Map
    • Hygeia Analytics – Who We Are
    • Why Hygeia?
    • Funding and “Sound Science”
    • Acronyms and Glossary
    • Sign-Up for Updates
  • Nutrition
    • Introduction and Nutrition 101
      • Good Fat Bad Fat
      • Fatty Acids
        • Primer on the Fatty Acids in Milk
      • Impact of Livestock Feeding
    • Antioxidants
      • Organic Farming Elevates Antioxidants
      • Maximizing Antioxidant Intake
    • Organic vs. Conventional Foods
      • Milk and Dairy Products
        • 2018 Grassmilk Paper
        • PLOS ONE Study
        • Dairy Meta-Analysis
      • Multi Food Meta-Analyses
        • Meat Products
        • Plant-Based Foods
        • Smith-Spangler et al.
        • Dangour et al.
        • The Organic Center Report
      • Food Specific Comparisons
        • General
        • Fruits and Vegetables
        • Wine and Wine Grapes
    • Considering Nutritional Quality
      • Impact of Genetics and Production Systems
      • New Tool for Food Security
      • Transforming Jane Doe’s Diet
      • Nutritional Quality Index
    • Nutrient Decline
    • Other Choices and Challenges
      • Human Health
      • Dietary Choices
  • Pesticides
    • Usage
      • Pesticide Use Data Sources
        • Pesticide Use Indicators
      • PUDS – The Pesticide Use Data System
    • Dietary Risks
      • The Dietary Risk Index (DRI)
    • Risk Assessment and Regulation
      • Food Quality Protection Act (FQPA)
      • Glyphosate/Roundup Case Study
      • The Lowdown on Roundup
      • Does Glyphosate/Roundup Cause Cancer?
      • 2019 Glyphosate Genotoxicity Paper
    • Impacts of GE on Pesticide Use
    • Environmental, Human Health, and Other Impacts of Pesticides
  • Ag Biotech
    • Key Historical Documents – Donald Duvick
    • Key Historical Documents – Arpad Pusztai
    • Herbicide Resistant Crops
    • Weed Resistance
    • Bt Transgenic Crops
    • Resistant Insects
    • Health Risks and Safety Assessments
    • Regulation of GE Crop Technology
    • Marketing, Economics, and Public Relations
    • Patenting and Intellectual Property Issues
    • Labeling
  • Other Issues
    • Animal Products
    • The Future of Food
    • Global Food Security
    • Natural Resources and Climate Change
    • Alternatives to Industrial Ag
    • Policy and Politics
    • Scientific Integrity
    • Soil Health
    • Yields
  • Recent Posts
    • Hot Science
    • In The News
    • Hygeia’s Blog
  • Special
    Coverage
    • Organic Apples in Washington State
    • Dicamba Drift Crisis
    • Organic Food Consumption Lowers Cancer Risk
    • Organic Integrity

USDA Data Shows Big Shift Upward Over Last Decade in Corn and Cotton Acreage Planted to Stacked Traits

Posted on July 25, 2018 in GMOs, In The News | 695 Views

USDA’s Economic Research Service (ERS) recently updated the data product Adoption of Genetically Engineered Crops in the U.S., and the new data provides important insights on the prevalence of so-called “stacked” varieties.

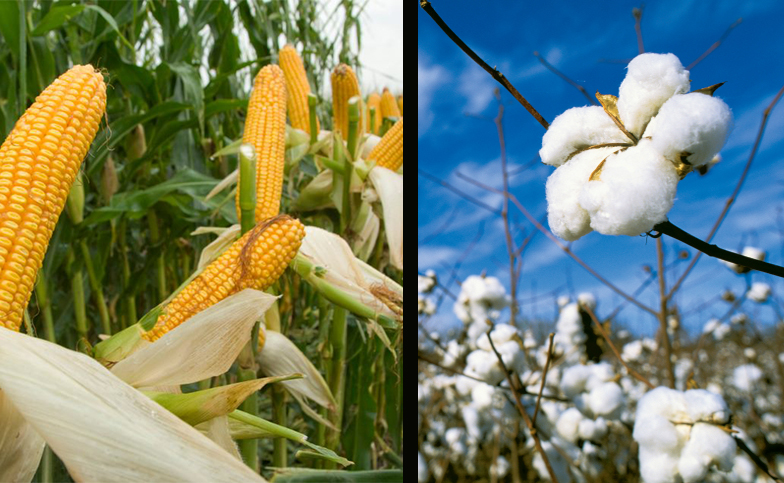
A “stacked” variety of GMO corn or cotton is engineered to express two or more distinct traits — typically herbicide tolerance (e.g., Roundup Ready) and Bt transgenic (i.e., insect protected).

The new release includes this USDA chart  illustrating the change over the last decade in the percentage of corn and cotton acreage planted to corn and soybean seed with stacked, GMO traits.  These types of GE seeds have been altered to be both

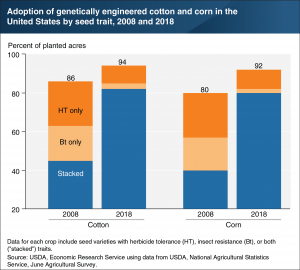
As evident in the chart, in 2008 45% of U.S. cotton and 40% of corn acreage were planted to stacked-trait varieties.  A decade later, these numbers doubled – with 82% of cotton acres and 80% of corn planted to GE corn expressing more than one trait.

We have discussed the stacking of GE traits before on Hygeia.  In many cases, traits that are individually considered “safe” are stacked with others without any research or assessment of the possible cumulative ecological or human health impacts of each new combination.

Number of Stacked Traits Undercounted

These data underestimate the number of stacked traits planted.  As Bt resistance-management provisions were relaxed, and insects in some regions became resistant to different Bt traits, companies added additional Bt traits in the hope of sustaining effective control.  Today on average, each acre of stacked-trait corn is expressing about 3 Bt traits, as well as one or more herbicide-tolerance trait.

In fact, Monsanto-Dow AgroScience’s SmartStax corn expresses 6 separate Bt traits, and two herbicide-tolerance traits, making it one of the most expensive corn seed technologies on the market. (The premium price charged for GMO corn and cotton is driven by the number of traits expressed).

More stacked traits in a variety of corn or cotton translate into higher seed costs for farmers, which is one reason the USDA is tracking trends in the number of stacked traits.

Source:

USDA, “Most U.S. corn and cotton acreage in 2018 used genetically engineered seeds with stacked traits,” July 20, 2018.


Posted in GMOs, In The News | Tagged Bt, GE Impacts

Related Posts

This Monster Dose of Innovation is Reason for Hope→

New Iowa Centric Verse of the Dicamba Blues→

Guest Blog: A Welcomed Dose of Straight Talk — “Making Liars of Proponents and Fools of Enablers”→

Back to the Future for Plant Breeders in Africa? A Fresh Look at One Scientist’s Dilemma→

Secretary Purdue Needs a Weed-Management 101 Briefing→

More Evidence that Herbicides Impact the Gut Microbiome, This Time It’s 2,4-D in Mice→

Guest Blog: A Dicamba Update from the Save Our Crops Coalition→

Dealing With Roundup’s Mammoth — and Growing — Ecological Footprint→

©2016 Hygeia-Analytics.com. All Rights Reserved.

Menu