
The Dietary Risk Index, or DRI, is a complex analytical system that quantifies the relative risks stemming from pesticides in food. The DRI value for a given food-pesticide combination takes into account the level of residues in the food, the chronic toxicity of the pesticide, and the typical number of grams in a single serving of the food.
Access the DRI here.
The DRI relies on U.S. Environmental Protection Agency (EPA) data on pesticide toxicity, and pesticide residue data from the U.S. Department of Agriculture (USDA), and United Kingdom-Food Standards Agency (UK-FSA) data. Pesticide risk levels are quantified in accord with recommended EPA and international pesticide dietary risk-assessment methods.
The DRI quantifies levels and trends in pesticide dietary risks by food and by pesticide, and as a function of the farming system used to produce a given sample of food (either conventional or organic). It quantifies dietary risks in food produced in different countries, and supports comparison of risk levels in domestically grown versus imported foods.
The DRI system produces tens of thousands of tables, each reporting food-pesticide relative risks for a given year at varying levels of aggregation. The tables highlight which foods and pesticides account for the greatest dietary risks, and which foods and pesticides contribute very little, or not at all to pesticide dietary risk.
Some of these tables are publicly accessible via our Interactive DRI Lookup Tools, while many more reports can be produced via direct queries to the underlying DRI system and its databases.
The DRI Lookup Tools provide an easy-to-use and publicly accessible way to assess which foods, grown where and how, have contained the highest — and sometimes unacceptable — pesticide risks. The DRI also demonstrates that many pesticide-food combinations do not warrant regulatory attention, or concern among public health scientists and consumers as a result of dietary exposures, based on EPA’s current assessments of pesticide chronic toxicity.
For more, see:
- Three Ways to Calculate DRI Values
- Accessing and Using Interactive DRI Output Tables
- DRI Results and How to Interpret Them
- Applications of the DRI
- Data Sources, Methodology, and other Technical Details
Three Ways to Calculate DRI Values
There are many ways to analyze and track pesticide dietary risks. Each provides useful insights, but also can be misleading, especially in isolation. It takes three DRI-based metrics to reliably assess pesticide risks in any given food, and across all foods and pesticides.
The DRI’s power and utility rests upon the ability to quickly measure pesticide risks in the following three ways (click on image boxes for details):
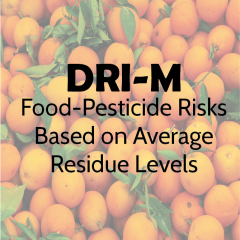
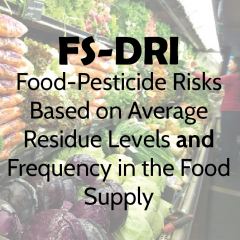
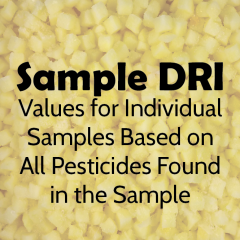
Accessing and Using Interactive DRI Lookup Tables
or on the image below to access the gateway to the current set of online, interactive DRI output tables.
The DRI system can generate close to one-half million annual tables reporting the frequency of residues and DRI risk levels in various foods or for different pesticides. Future, interactive DRI output tables will cover, among other things, changes in risk metrics over time, across food groups, and by pesticide type and family of chemistry (e.g. the neonics, OPs, or post-harvest fungicides).
How to Use the DRI Lookup Tools
There are 5 different lookup tools available now to access and download data from the DRI system. Upon accessing the DRI, you will be asked to choose one of the following five tools:
- DRI by Commodifty – reports all residues found in a given food in a given year
- DRI by Pesticide – reports all foods that contained a given pesticide in a year
- Organic vs. Conventional – compares DRI values for a given food in organically vs. conventionally grown samples
- Domestic vs. Imported – compares DRI values for a given food in domestically grown vs. imported samples
- Impacts of the Food Quality Protection Act of 1996 (FQPA) – compares pre-FQPA DRI values for a select group of major foods that were tested five or more times with values reported in 2000, 2004, and 2011, quantifying the impact of this seminal legislation on pesticide dietary residues.
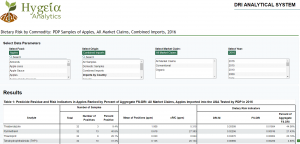
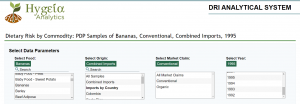
Once you open your chosen tool, you select parameters from the drop-down lists at the top of the page. These choices will vary depending on what tool you are using, but may include a selection of foods, pesticides, production system (organic or conventional), country of origin, and year.
In the example shown below, the user has chosen the By Commodity tool and has selected Bananas, Combined Imports, Conventional, and 1995. As the title at the top of the page reflects, the table generated will list DRI values from US-PDP samples tested in 1995 of imported, conventionally-grown bananas.
Additional tables in the Lookup Tools identify the regulatory variables that went into calculating the DRI values, such as the chronic reference dose (cRfD) and whether the 10-x safety factor called for by the Food Quality Protection Act (FQPA) was applied.
More information on the extensive array of output reports that can be generated by the DRI system, and how to interpret DRI values, is available here.
Applications of the DRI

Hygeia Analytics, the Heartland Study, and our research partners are using the DRI system to better understand the levels and distribution of pesticide residues and dietary risk, as well as trends in pesticide risk.
Some applications focus mostly on U.S. grown foods, others drill down to explore risks in domestically produced foods versus imports.
Food companies sourcing ingredients from around the world need up-to-date, accurate information regarding where possibly high-risk raw grains, fruits, and vegetables, spices or cooking oils, and other food ingredients are coming from.
Some analysts use the DRI to better understand the contributions of specific pesticides to overall risk, or risks arising from all pesticide active ingredients within a family of pesticide chemistry (e.g. all organophosphate [OP] or neonicotinoid insecticides, or all phenoxy herbicides).
For those advocating — or opposing — substantial restrictions on a particular pesticide, the DRI system provides valuable insight into the potential for “risk trading.”
For example, banning all food uses of OP insecticides or glyphosate herbicide will surely reduce risks from these pesticides, but as other insecticides and herbicides are relied upon more heavily by conventional farmers, might the risks arising from wider use of alternative pesticides equal, or even exceed OP-related or glyphosate-related risks?
The sale of organic food has been growing rapidly for nearly two decades. Are consumers who buy organic food in the hope of reducing pesticide exposures and dietary risk getting their money’s worth?
A set of DRI output tables answer this question each year in the case of foods for which the US-PDP and UK-FSA tests an adequate number of organic samples to reliable compare residues and risks in organic versus conventional samples of the same food.
Last, policy wonks and researchers can use the DRI system to quantify the impacts of a change in pesticide law or risk assessment policy on trends in dietary risk.
Likewise, the DRI can shed light on how the spread of insects or weeds resistant to once-effective pesticides has altered pesticide use and dietary risk patterns. It can also help in tracking the impacts of consolidation within the pesticide industry, the registration of an important new pesticide, or a new bilateral or multilateral trade agreement.
Some DRI applications designed to address the above research questions are described below:


See more:
- Introduction to Pesticide Dietary Risks
- Learn more about the Three Ways to Measure the DRI
- Access DRI Data via our Interactive DRI Lookup Tools
- Understand DRI Results and How to Interpret Them
- See DRI Technical Details such as data sources and methodology
- Scientific research on pesticide dietary risks at the Heartland Study