Hygeia AnalyticsLogo

Menu

Skip to content
  • Home
  • About Hygeia
    Analytics
    • Dynamic Presentations
    • Keywords and Site Map
    • Hygeia Analytics – Who We Are
    • Why Hygeia?
    • Funding and “Sound Science”
    • Acronyms and Glossary
    • Sign-Up for Updates
  • Nutrition
    • Introduction and Nutrition 101
      • Good Fat Bad Fat
      • Fatty Acids
        • Primer on the Fatty Acids in Milk
      • Impact of Livestock Feeding
    • Antioxidants
      • Organic Farming Elevates Antioxidants
      • Maximizing Antioxidant Intake
    • Organic vs. Conventional Foods
      • Milk and Dairy Products
        • 2018 Grassmilk Paper
        • PLOS ONE Study
        • Dairy Meta-Analysis
      • Multi Food Meta-Analyses
        • Meat Products
        • Plant-Based Foods
        • Smith-Spangler et al.
        • Dangour et al.
        • The Organic Center Report
      • Food Specific Comparisons
        • General
        • Fruits and Vegetables
        • Wine and Wine Grapes
    • Considering Nutritional Quality
      • Impact of Genetics and Production Systems
      • New Tool for Food Security
      • Transforming Jane Doe’s Diet
      • Nutritional Quality Index
    • Nutrient Decline
    • Other Choices and Challenges
      • Human Health
      • Dietary Choices
  • Pesticides
    • Usage
      • Pesticide Use Data Sources
        • Pesticide Use Indicators
      • PUDS – The Pesticide Use Data System
    • Dietary Risks
      • The Dietary Risk Index (DRI)
    • Risk Assessment and Regulation
      • Food Quality Protection Act (FQPA)
      • Glyphosate/Roundup Case Study
      • The Lowdown on Roundup
      • Does Glyphosate/Roundup Cause Cancer?
      • 2019 Glyphosate Genotoxicity Paper
    • Impacts of GE on Pesticide Use
    • Environmental, Human Health, and Other Impacts of Pesticides
  • Ag Biotech
    • Key Historical Documents – Donald Duvick
    • Key Historical Documents – Arpad Pusztai
    • Herbicide Resistant Crops
    • Weed Resistance
    • Bt Transgenic Crops
    • Resistant Insects
    • Health Risks and Safety Assessments
    • Regulation of GE Crop Technology
    • Marketing, Economics, and Public Relations
    • Patenting and Intellectual Property Issues
    • Labeling
  • Other Issues
    • Animal Products
    • The Future of Food
    • Global Food Security
    • Natural Resources and Climate Change
    • Alternatives to Industrial Ag
    • Policy and Politics
    • Scientific Integrity
    • Soil Health
    • Yields
  • Recent Posts
    • Hot Science
    • In The News
    • Hygeia’s Blog
  • Special
    Coverage
    • Organic Apples in Washington State
    • Dicamba Drift Crisis
    • Organic Food Consumption Lowers Cancer Risk
    • Organic Integrity

The Cost of Food in America — The Highest and Lowest in the World at the Same Time?

Posted on November 26, 2018 in Food Security, In The News | 358 Views

Americans enjoy the cheapest food in the world. The American food supply is among the most expensive in the world.

Both statements are true. How can that be?

America is the richest country in the world, so when the cost of food in the U.S. is measured as a percentage of average per capita income, we rank #1 in terms of the “cheapest [i.e. most easily afforded] food” in the world.

The cost of the food consumed daily by the average American is very close to the top of global rankings in terms of the money we spend to meet our caloric and nutritional needs each day.

Understanding things like food costs and food security across countries is tricky business that requires a ton of data and a lot of high-powered analytical tools. Kudos to the Intelligence Unit of The Economist magazine for pushing the envelope with its 2018 ranking of 113 countries, based on its Global Food Security Index (GFSI). The 2018 report is focused on “Building Resilience in the Face of Rising Food-Security Risk.”

The analytical model and data behind the index is impressive and has been incrementally improved over six, annual iterations. This year’s report adds to the index a new component — the 2018 GFSI Natural Resources and Resilience rankings table.

This new index strives to capture the degree to which each country is taking concrete actions to adapt to, and prevent major disruptions in food security driven by natural disasters, climate change, soil degradation, and water shortages.

In terms of food security, modest progress has been made globally across most countries since the 2017 ranking, brought about mostly by investments in infrastructure, growth in production capacity, and relatively stable food prices.

Based on the overall GFSI — without the new natural resources and resilience component — the U.S. fell from #2 to a tie for #3 with the United Kingdom, behind #1 Singapore and #2 Ireland.

But in the case of the new GFSI index focused just on natural resources and resiliency, the U.S. ranking drops all the way down to 44th out of 113 countries, with a total GFSI score of 64.9. The top four countries — Slovakia, Denmark, Czech Republic, and Austria — all scored between 81.7 and 80.2.

The U.S. was tied for #3 with the United Kingdom in the Global Food Security Index, but falls all the way to #44 when in a newly-added ranking that accounts for natural resources and climate change resiliency. Graphic: The Economist, emphasis added by Hygeia.

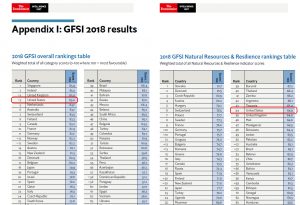
Ten countries scored below 50, a list with several surprises: Israel, United Arab Emirates, Peru, Saudi Arabia. These are among the countries for which future food security is most vulnerable in the wake of expected climate change and trends in natural resource availability and productivity.

The #1 country in terms of the previous GFSI — Singapore — is ranked 103rd in terms of resources and resiliency.

When the new GFSI is adjusted to take into account the new resources and resiliency score, Switzerland moves to #1, followed by several EU countries and Canada. The U.S. and UK remain tied, but now in 8th place.

This useful analytical exercise is leading to new and better ways to keep track of how different countries are doing in terms of food security. It also helps identify the actions and initiatives in certain countries that are improving food security over time, while also serving as an early-warning system for countries and regions headed in the wrong direction.

Source:

The Economist, Global Food Security Index 2018: Building Resilience in the Face of Rising Food-Security Risks, November 2018.

Posted in Food Security, In The News | Tagged Climate Change, Economics, Food Security, Natural Resources

Related Posts

FAQs re Biden-Harris Ag and EPA Transition Priorities→

This Monster Dose of Innovation is Reason for Hope→

Are We Ready for Grassland 2.0?→

Early-Life Insecticide Exposure Compromises Brain Development in Bees→

Math Mythology and More of the Same: USDA’s Sustainability Plan→

Cargill Announcement: Just Say No to Glufosinate-Desiccated Lentils from Canada→

A Closer Look at InsideClimate News’ Award-Winning Series on How American Farm Policy is Deeply Rooted in Resistance to Climate Change Adaptation→

Back to the Future for Plant Breeders in Africa? A Fresh Look at One Scientist’s Dilemma→

©2016 Hygeia-Analytics.com. All Rights Reserved.

Menu